Greyhound Sectional Times and Speed Ratings
Best Greyhound Betting Sites – Bet on Greyhounds in 2026
Loading...
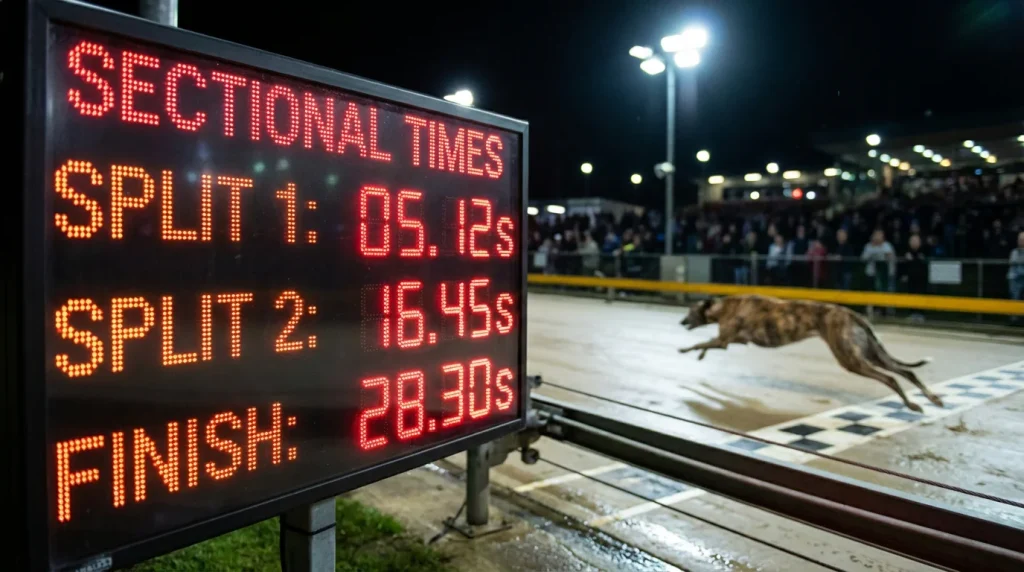
Sectional Times: The Data Beneath the Finishing Time
The finishing time tells you how fast a greyhound ran. Sectional times tell you how it ran — and that distinction changes everything. A dog that completes 480 metres in 29.40 has produced a measurable performance. But was it a front-runner that blazed through the opening two bends and held on grimly through the closing straight? Or a patient closer that sat fourth into the third bend and powered home in the final 100 metres? Both scenarios can produce a 29.40, yet the two dogs are entirely different betting propositions for their next race. Sectional times answer the question that the finishing time leaves open.
For the punter willing to work with this data, sectional times reveal running patterns, pace profiles, and race-shape dynamics that are invisible in raw results. They transform form reading from a backward-looking summary into a forward-looking predictive tool — because a dog’s sectional profile in one race can tell you how it will perform in a different race under different conditions.
What Sectional Times Measure
Sectional times break a race into segments, each measured individually. The standard segments at most UK tracks are the run-up (from trap to the first timing beam), the first bend, the back straight, the far bends, and the run-in to the finish line. Not every track publishes full sectional data, and the exact split points vary by circuit, but the principle is consistent: each section captures a distinct phase of the race.
The run-up time measures trap speed — how quickly the dog exits the starting trap and reaches full stride. This is the most reliable indicator of early pace, and it correlates directly with first-bend position. A dog with consistently fast run-up times is a front-runner by nature; one with slower run-up times is a dog that needs time to reach its racing speed and is more likely to be racing from behind in the early stages.
Mid-race sectionals cover the bends and back straight, revealing whether a dog sustains its speed through the turns or loses ground. Bend speed is particularly telling: some dogs decelerate noticeably through tight bends (often because of their running style or physique), while others maintain their pace or even accelerate. This data is critical for track-specific analysis — a dog that handles the bends well at a tight circuit like Romford may be at a disadvantage at a track with more gradual turns, and vice versa.
The closing sectional — the final straight or run-in — tells you whether a dog finishes strongly or fades. A dog that posts fast closing sectionals consistently is a strong finisher, and its finishing time may understate its capability if it was held up by traffic earlier in the race. Conversely, a dog with weak closing sectionals is front-runner dependent: if it doesn’t lead, it probably won’t close.
Calculated Times vs Clock Times
Calculated times adjust for track speed and conditions. They let you compare a run at Romford with a run at Hove — which raw times cannot do. The distinction between clock time and calculated time is one of the most important in greyhound form analysis, and punters who ignore it are making comparisons that are mathematically invalid.
A clock time of 29.30 is a literal measurement: the dog took 29.30 seconds to complete the distance. But if the track was running 0.20 seconds fast that evening — due to dry conditions, a recently maintained surface, or favourable wind — then every dog benefited equally. The 29.30 run, on a fast track, is equivalent to roughly 29.50 on a standard track. The calculated time makes that adjustment, producing a figure that represents the dog’s performance in normalised conditions.
The adjustment works in both directions. On a slow track — wet surface, heavy going — times are slower across the board. A calculated time strips away the conditions’ effect and reveals the underlying performance. This is why a dog running 29.80 on a heavy track can have a better calculated time than a dog running 29.50 on a fast track: the conditions flattering the faster raw time but penalising the slower one.
Calculated times are published by the Racing Post, Timeform, and several subscription-based data services. They are the correct basis for comparing dogs that have raced at different tracks, on different nights, or in different conditions. If you’re using raw clock times to compare runners in the same race, you’re introducing noise that may lead you to the wrong conclusion.
Speed Ratings: Reducing Performance to a Number
Speed ratings take the concept of calculated times one step further, converting a performance into a single numerical figure that allows direct comparison across dogs, tracks, and time periods. Timeform’s greyhound ratings and the Racing Post’s speed figures are the two most widely used systems in UK greyhound betting.
A speed rating typically works on a scale where higher numbers indicate better performances. A dog rated 85 has performed at a higher level than a dog rated 75, regardless of the track, distance, or conditions under which each figure was recorded. The rating systems use proprietary algorithms that account for track speed, distance, grade, and the quality of the opposition, producing a figure that aims to isolate the dog’s individual performance from all external factors.
The strengths of speed ratings are portability and simplicity. You can compare any dog with any other dog using a single number. In a six-dog race, the dog with the highest peak speed rating has, historically, been the most capable runner in the field — though not necessarily the most likely winner, because ratings don’t account for the trap draw, running style compatibility, or current fitness.
The limitations are equally important. Speed ratings are backward-looking: they measure what a dog has done, not what it will do. A dog whose best rating was achieved three months ago may have declined since then. Ratings don’t capture draw effects, interference, or other race-specific factors that influenced the performance. And the algorithms are imperfect — edge cases, unusual conditions, and small-sample-size performances can produce ratings that overstate or understate true ability. Use ratings as a starting point for comparison, not as a final verdict.
Using Sectional Times to Identify Pace Scenarios
Fast early sectionals packed into traps 1 and 2 suggest a pace battle. The wide runner in trap 6 may inherit the lead at the third bend while the inside runners tire from contesting the early pace. This kind of race-shape prediction is the practical payoff of sectional analysis — and it’s information the market rarely prices in.
Before a race, check the run-up times and early sectionals of each runner. If three dogs have fast early sectionals and are drawn in traps 1, 2 and 3, the inside is going to be congested and fast from the start. That early pace will create interference and fatigue, benefiting any runner that avoids it — typically a wide runner with moderate early speed and strong closing sectionals. The sectional data hands you a race narrative before the race has been run, and that narrative is the basis for a bet that most other punters, relying on finishing times alone, won’t see.
Time Is Truth — When You Adjust for Context
Raw times lie. Adjusted times approximate truth. Sectional times get closest to the full story. The hierarchy is clear, and moving up it — from raw times to calculated times to sectional analysis — takes your form reading from superficial to substantive. The data is available. The tools are accessible. The only barrier is the willingness to engage with it rather than defaulting to finishing positions and gut instinct.